
How Monte Carlo Works
How are Monte Carlo simulations run and where do the assumptions come from?
How Monte Carlo Works in WealthTrace
Monte Carlo analysis estimates how often a retirement plan “works” by running many possible market paths and checking whether the plan runs out of money in any of them.
What WealthTrace simulates
For each simulation, WealthTrace generates a year-by-year set of total returns for every investment in the plan. Returns vary from year to year based on:
- the investment’s expected return (Annual Return assumption),
- the investment’s asset class,
- the asset class’s volatility (standard deviation),
- how asset classes move together (correlations),
- whether spending is changed based on the investment value in each simulation; read more about Monte Carlo guardrails here.
Linked Accounts: How Holdings Drive Returns & Correlations
When an investment account is linked, WealthTrace uses the asset class of each holding (as provided by the financial institution) to model returns more accurately.
- Holding-level asset classes: Each security (stock fund, bond fund, cash, etc.) is assigned an asset class or mix of asset classes based on the custodian’s data.
- Each investment return is built from holdings: In each simulation year, WealthTrace applies the simulated return for each holding’s asset class, then combines them to produce each investment account’s overall return.
- Correlations happen through asset classes: Because each holding is tied to an asset class, the account naturally reflects diversification and co-movement—asset classes that historically move together will rise/fall together in the simulation, while less-related asset classes will vary more independently.
This is why linked accounts can produce more realistic Monte Carlo results: returns are modeled using the actual asset-class mix of the holdings, rather than a single blanket assumption for the whole account.
Step 1: Create 1,000 return paths
We run 1,000 simulations. For each year in the plan and for each asset class, the program generates a random return “shock” that reflects:
- the asset class’s volatility, and
- its correlation with other asset classes (so diversified portfolios behave realistically).
By default, return shocks are assumed to follow a Normal distribution. You can optionally switch to a Laplace distribution, which puts more weight on extreme outcomes than the Normal distribution. See the screenshot below for where to view and edit Monte Carlo assumptions.
Step 2: Apply returns to each investment
Each investment has:
- an Annual Return assumption (used as the expected/average return), and
- an asset class classification.
For linked accounts, WealthTrace typically assigns asset classes automatically based on information provided by the financial institution.
In each simulation, each investment’s annual return is adjusted up or down around its expected return using that year’s simulated asset-class return.
Asset class volatility and correlations are calibrated using long-term historical data (about 50 years).
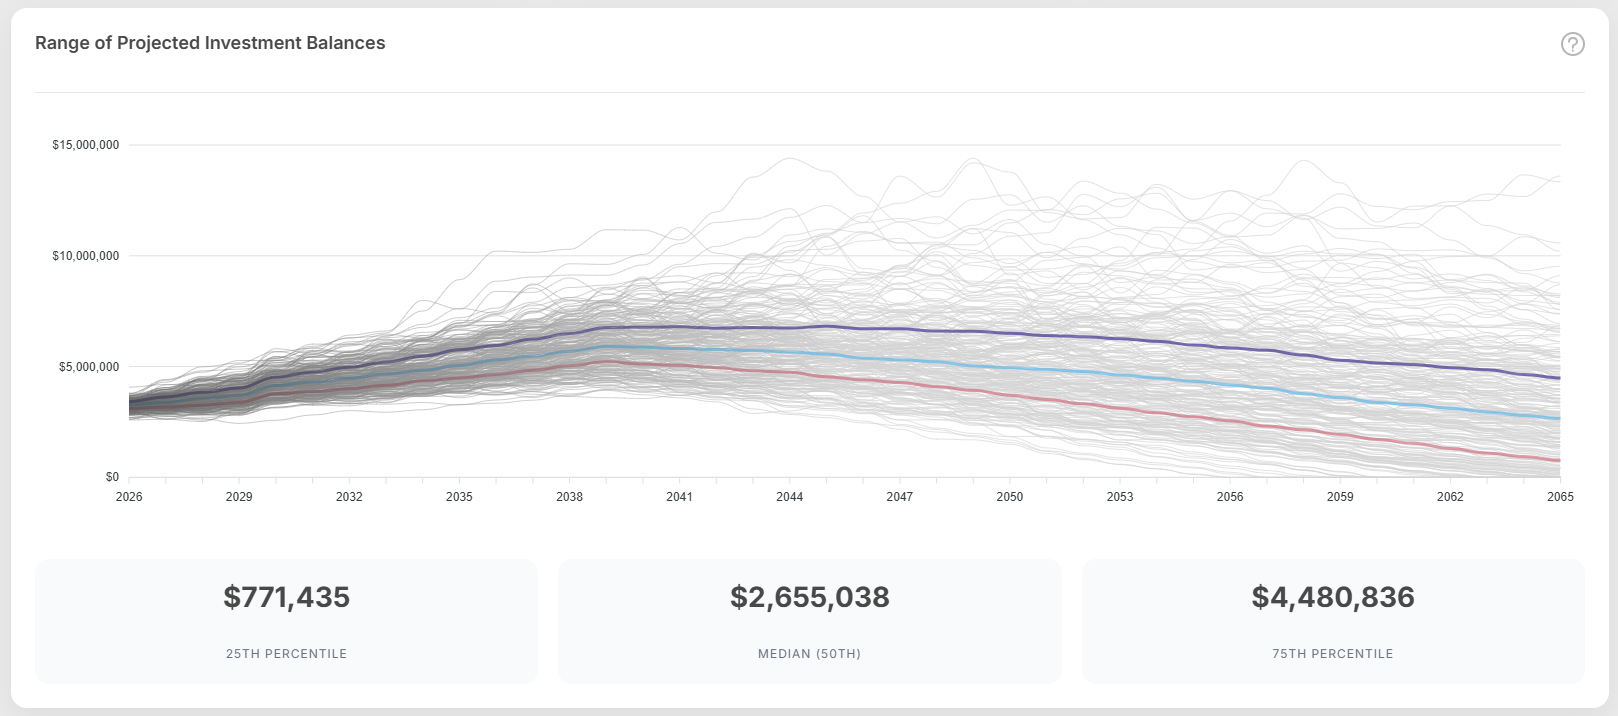
Step 3: Determine whether the plan succeeds
For each simulation, WealthTrace runs the full retirement plan (contributions, withdrawals, taxes, expenses, etc.) and checks:
- Success: the plan does not run out of money before the end of the planning period
- Failure: the plan runs out of money at some point
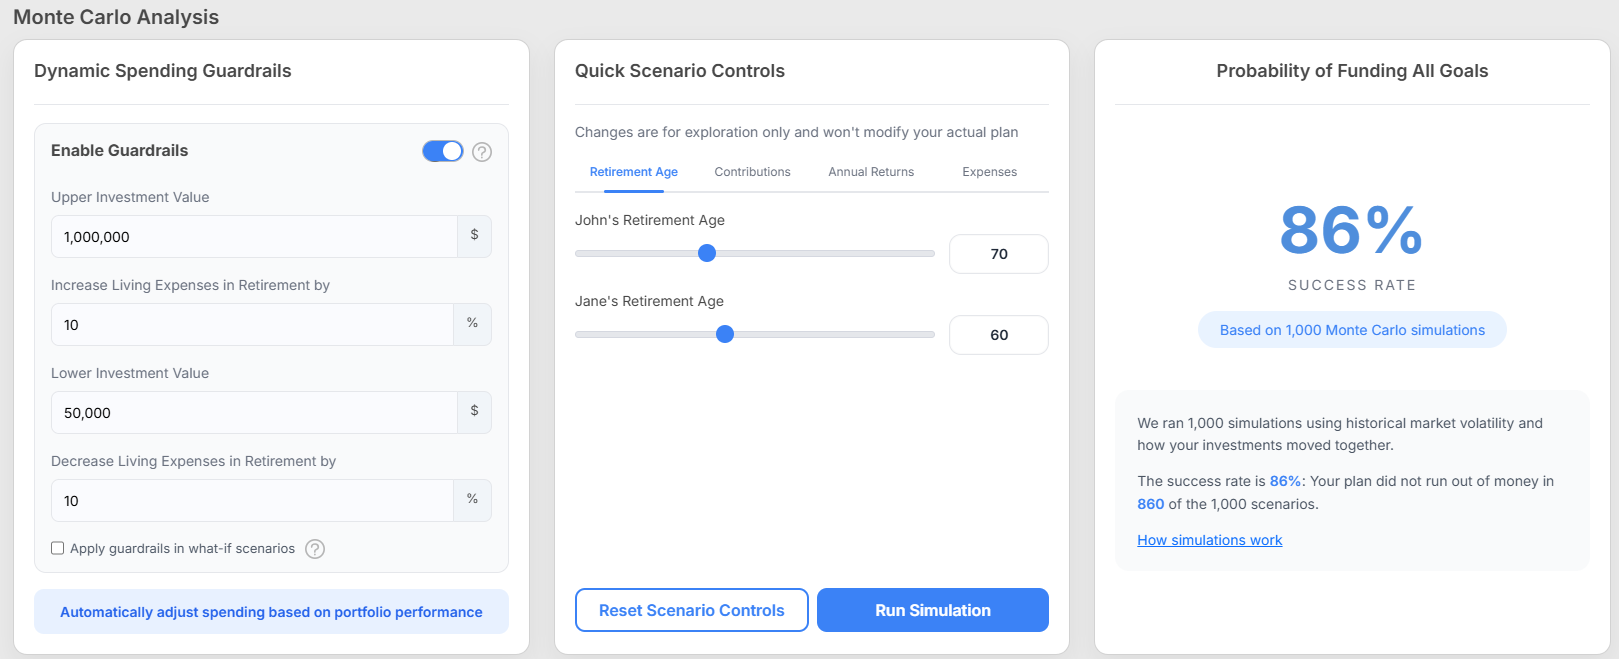
The “Success Rate” (Probability of Funding All Goals)
After 1,000 simulations, WealthTrace calculates:
Success Rate = simulations that don’t run out of money ÷ 1,000
Example: If 920 out of 1,000 simulations succeed, the success rate is 92%.
You can read more in our Monte Carlo retirement simulations blog post.
