
Monte Carlo Guardrails
How do I change my spending behavior in Monte Carlo simulations based on how my portfolio is doing?
Dynamic Spending Monte Carlo Guardrails
Dynamic Spending Guardrails let you model a simple, rules-based spending change inside the Monte Carlo simulation:
- If the portfolio value rises above an upper threshold, the simulation assumes you increase spending on living expenses in retirement by a set percentage.
- If the portfolio value falls below a lower threshold, the simulation assumes you decrease spending on living expenses in retirement by a set percentage.
- If the portfolio stays between the two thresholds, spending stays on the baseline path.
This helps your results reflect how many people actually behave: spending a bit more when things are going well and tightening up when markets go against them.

How it works in the simulation
For each Monte Carlo trial (each simulated “path”) in every year, the engine checks the portfolio value during retirement and applies the rule:
- Above “Upper Investment Value” → Increase Living Expenses in Retirement by X%
- Below “Lower Investment Value” → Decrease Living Expenses in Retirement by Y%
- Between thresholds → No change
The adjustment is applied to living expenses in retirement (not wages, not contributions), and only when guardrails are enabled.
In the example screenshot above, here is how it will work: If the portfolio value goes above $1.8M in any simulation in any year, they will increase their spending on living expenses by 10%. If the portfolio value goes below $1.2M in any simulation in any year, they will decrease their spending on living expenses by 15%.
Settings explained (from the screen)
- Enable Guardrails
Turns the behavior on/off. - Upper Investment Value ($)
The portfolio value that triggers an increase in spending. - Increase Living Expenses in Retirement by (%)
How much the simulation increases retirement living expenses when the portfolio is above the upper threshold. - Lower Investment Value ($)
The portfolio value that triggers a decrease in spending. - Decrease Living Expenses in Retirement by (%)
How much the simulation decreases retirement living expenses when the portfolio is below the lower threshold. - Apply guardrails in what-if scenarios
If checked, the same guardrail rules are also applied when you run what-if comparisons.
What this changes (and what it doesn’t)
- It does change the spending path inside each simulation based on portfolio performance relative to your thresholds.
- It does not try to “optimize” spending year-by-year or make complex decisions—this is a straightforward threshold rule you control.
How to Read the Monte Carlo Guardrails Graph
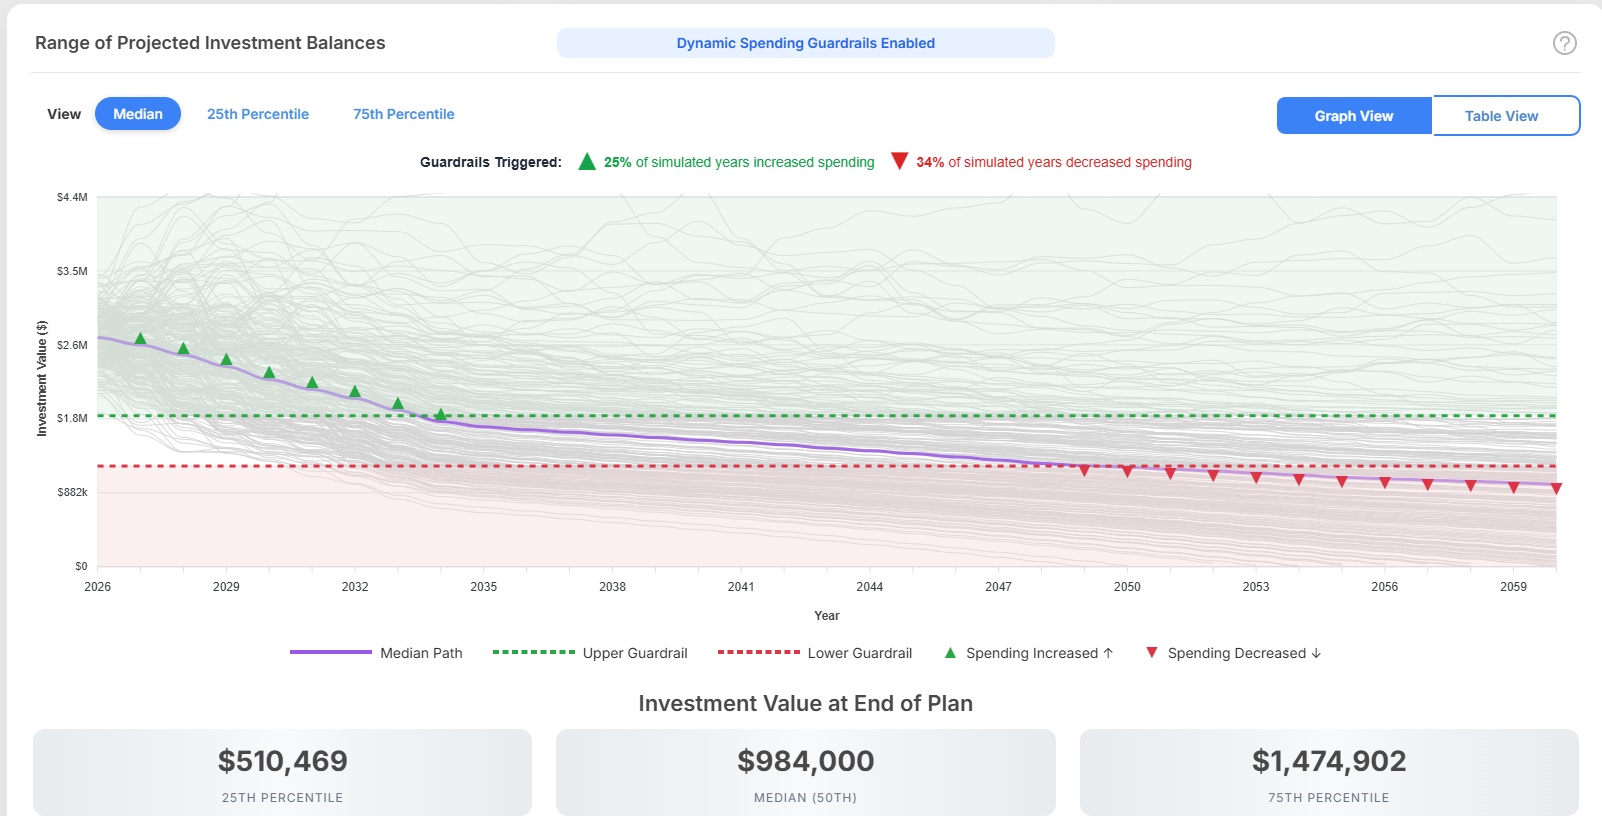
This graph shows the range of projected portfolio balances over time when Monte Carlo simulations are used with dynamic guardrails enabled. It combines the full spread of simulated outcomes with a highlighted summary path and markers showing when spending adjustments occurred.
What the graph shows
The chart displays many possible portfolio paths across the full planning horizon.
- The gray lines represent individual simulated outcomes.
- The purple line shows the selected summary path for the chosen view.
- The green and red dashed lines show the guardrail thresholds.
- The green and red triangle markers show the years when spending adjustments were triggered.
Together, these elements show both the range of possible outcomes and how the plan responded over time.
View options
At the top of the chart, you can switch between:
- Median
- 25th Percentile
- 75th Percentile
These views change the highlighted summary path and the end-of-plan values shown below the chart.
Median shows the middle outcome. Half of the simulations finish above it and half finish below it.
25th Percentile shows the simulation path ranked near the lower end of the results based on ending investment value. Because 1,000 simulations are run the 25th percentile is the path ranked 250th out of 1,000.
75th Percentile shows the simulation path ranked near the upper end of the results based on ending investment value. Because 1,000 simulations are run the 75th percentile is the path ranked 750th out of 1,000.
In the example shown, the Median view is selected, so the purple line represents the median projected portfolio path.